Where journalism meets data

Need to learn new data skills, increase your data journalism knowledge or advance your career?

Maximalfocus Hak Txidk36 I unsplash 2

The State of Data Journalism Survey 2023

What are the biggest challenges facing data journalists worldwide? Share your insights with us about the state of data journalism in our latest survey available in English, Italian, and Spanish. Survey participants could win a free trip to the IJF 2024 in Perugia. The survey is open until 11 January 2024.

Screenshot 2023 12 04 at 14 00 14

Covering issues

Telling climate stories through a solutions and data lens

How solutions storytelling can engage local communities on mitigating the climate crisis

The time is now for journalists to halt the doom and gloom narrative around the climate crisis and instead reframe the narrative with a solutions approach. Journalist Sherry Ricchiardi examines how to tell such solutions stories with data by highlighting case studies from Unbias The News and the BBC.

Screenshot 2023 12 04 at 14 07 55

Best practices

How to approach environmental investigations with OSINT

Hear what it takes to bring open source data to uncover the invisible

Our latest blog sums up our Conversations With Data podcast episode on covering environmental investigations with open source intelligence (OSINT). We sat down with Sam Leon from Data Desk and Ben Heubl from Süddeutsche Zeitung who explained what it takes to uncover environmental wrongdoing with satellite data, maps and more.

Ecojustice

Covering issues

Here's what we learned from our podcast series on environmental justice

In our latest Conversations With Data episode, we spoke with two award-winning journalists covering race and environmental justice. The pair explain how data and solutions journalism inform their reporting. They point to some excellent resources to support your knowledge of the intersection between race and climate issues.

Screenshot 2023 10 02 at 12 04 47

Data visualisation

Reshaping how we visualise the climate crisis

How people interpret the climate crisis is being reimagined by a team of researchers, designers and journalists. The result is a new dashboard visualising climate metrics in a new light. Writer Duncan Geere explains how it all came together and what it means for climate journalists.

Womenwood

Covering issues

Data gives voice to women on climate change

How to cover the climate crisis with a focus on gender

Scientific evidence clearly shows that women bear the brunt of climate change, yet until recently, scant attention has been paid to their plight. In many instances, the data are there, waiting to be discovered. Sherry Ricchiardi examines how to cover this pressing topic with solutions reporting underpinned by data.

Screenshot 2023 12 14 at 12 55 42

Awards

Climate Journalism Award

Winners announced

The Climate Journalism Award ceremony took place in October 2023 in Lisbon at the News Impact Summit. Hosted by the European Journalism Centre and sponsored by Google News Initiative, the award attracted 181 entries from 46 countries. Check out the winning entries of the five award categories.

Data Handbook 2 cover

Data Journalism Handbook 2

Towards a Critical Data Practice

What is data journalism? What is it for? What might it do? What opportunities and limitations does it present? Who and what is involved in making sense of it? This book is a collaborative experiment responding to these and other questions.

VERIFICATION HANDBOOK 3 FRONT squashed squashed

Best practices

Verification Handbook +Translations

For Disinformation And Media Manipulation

The Verification Handbook brings a fresh new angle to the extremely relevant topics of misinformation and disinformation. The book is available for free download in English, Arabic, Turkish, Italian and German.

section figure

Our original Long Reads, written by the best data experts

Covering issues

Climate change through a solutions and data lens

How solutions storytelling can engage local communities and bring local reporters together to solve the climate crisis.

Data visualisation

New climate metrics for new climate conversations

New metrics and visualisations are being developed by a multidisciplinary team of researchers, designers and journalists to reshape how we interpret the climate crisis and its impact on people's daily lives.

Data collection

Data gives voice to women on climate change

Scientific evidence clearly shows that women bear the brunt of climate change, yet until recently, scant attention has been paid to their plight. In many instances, the data are there, waiting to be discovered.

Case studies

Kill switch: reporting on and during internet shutdowns

What can data journalists do to report on Internet shutdowns, which are becoming increasingly common by governments? This article provides a guide with real-world examples you can use to raise your voice.

Data analysis

Putting data back into context

Data are never neutral ‘givens’, but always situated in a particular context, collected for a particular reason -- and it’s crucial that data journalists understand these.

Data visualisation

The unspoken rules of visualisation

Designers often follow a set of strict conventions when creating visualisations. Kaiser Fung examines the fundamental rules of data visualisation, why they are important, and when it is okay to break them.

Covering issues

Reporting beyond the case numbers: How to brainstorm COVID-19 data story ideas

While many journalists around the world report the daily infection rate and death toll of COVID-19, audiences are seeking other stories that show the impact of the virus on their lives. How can journalists tell those wider stories with data?

Data visualisation

The essential lies in news maps

In order to display three-dimensional world we live in, journalists are forced to distort reality. And every map does so in its own way. Maarten Lambrechts looks at commonly used maps and how to avoid being misled by them.

Data visualisation

The essential lies in news maps

In order to display three-dimensional world we live in, journalists are forced to distort reality. And every map does so in its own way. Maarten Lambrechts looks at commonly used maps and how to avoid being misled by them.

Data analysis

Putting data back into context

Data are never neutral ‘givens’, but always situated in a particular context, collected for a particular reason -- and it’s crucial that data journalists understand these.

Data analysis

Spreadsheets for journalism

Many journalists see themselves as “word people” and shy away from writing about numbers. Brant Houston shows how to embrace math with an overview of spreadsheets and functions for beginners.

Data visualisation

Ethics

Designing data visualisations with empathy

How do you get audience members, much less the journalists presenting a story, to walk a mile in the shoes of a dot? Or a bar chart? P. Kim Bui provides three approaches for achieving empathy in data visualisations.

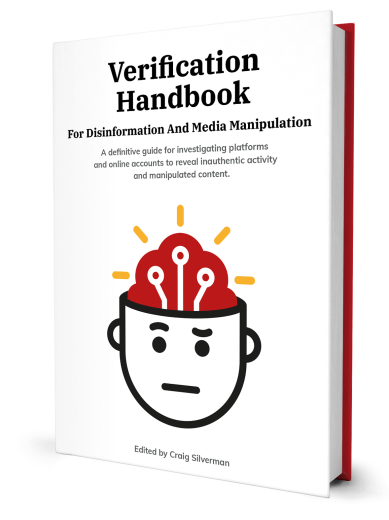
For Disinformation And Media Manipulation

The latest edition of the Verification Handbook arrives at a critical moment. Today’s information environment is more chaotic and easier to manipulate than ever before. This book equips journalists with the knowledge to investigate social media accounts, bots, private messaging apps, information operations, deep fakes, as well as other forms of disinformation and media manipulation.
VERIFICATION HANDBOOK 3 LEFT homepage

The first resource of its kind, it builds on the first edition of the Verification Handbook and the Verification Handbook for Investigative Reporting.

The book is published by the European Journalism Centre and supported by Craig Newmark Philanthropies.

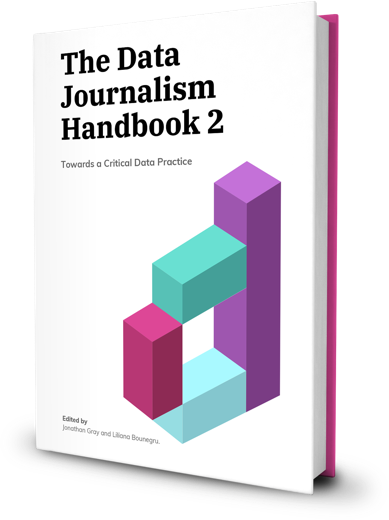
Towards a Critical Data Practice

What is data journalism? What is it for? What might it do? What opportunities and limitations does it present? Who and what is involved in making and making sense of it?
Data Handbook 2 cover

The new edition of the Data Journalism Handbook explores new and innovative ways in which data is analysed, created and used in the context of journalism. And beyond that: it also reflects on the social, cultural, political and economic circumstances in which data journalism is embedded.

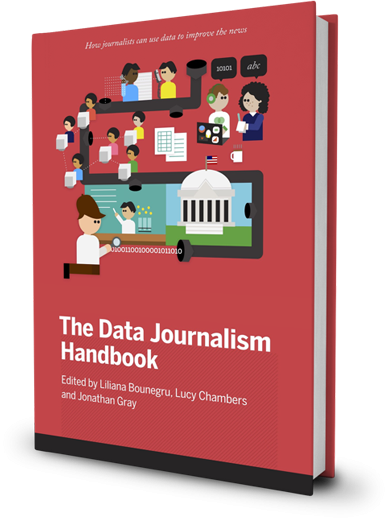
How journalists can use data to improve the news

When you combine the sheer scale and range of digital information now available with a journalist’s "nose for news" and her ability to tell a compelling story, a new world of possibility opens up. Explore the potential, limits, and applied uses of this new and fascinating field.
Data Handbook 1 Cover

This valuable handbook has attracted scores of contributors since the European Journalism Centre and the Open Knowledge Foundation launched the project at MozFest 2011. Through a collection of tips and techniques from leading journalists, professors, software developers, and data analysts, you’ll learn how data can be either the source of data journalism or a tool with which the story is told—or both.

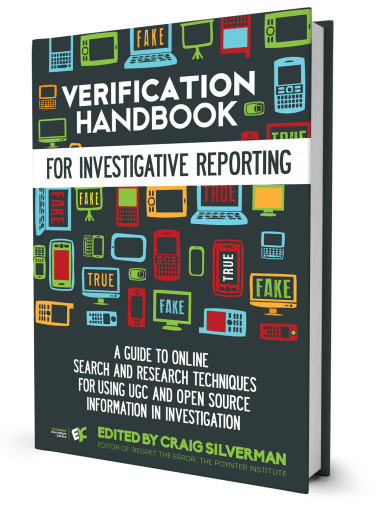
A Guide To Online Search And Research Techniques For Using UGC And Open Source Information In Investigations

Based on the conclusions of the first book, this second edition of the Verification Handbook sheds light on the use of open data and open source information to produce critical journalistic investigations.
VERIFICATION HANDBOOK 2 LEFT homepage

As new challenges have emerged in the digital sphere, wider opportunities to carry out more comprehensive investigations have arisen as well. The authors of the book take the reader on a walk-through to hone their online investigation tactics, providing them with step-by-step guidance to apply research, fact-checking, and data journalism techniques.

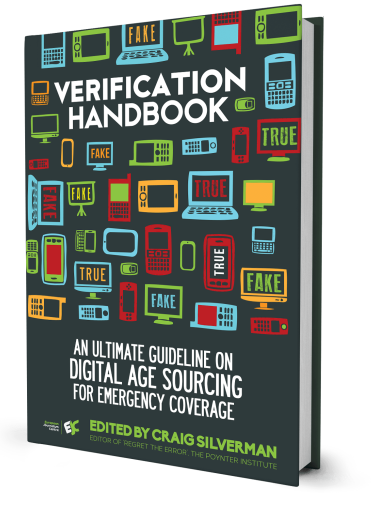
A Definitive Guide To Verifying Digital Content For Emergency Coverage

The first edition of the Verification Handbook has become a definitive reference for professionals worldwide. This book laid the foundations for the process of digital content verification and opened a necessary debate about the steps to follow for ensuring the accuracy of reporting within emergency situations.
VERIFICATION HANDBOOK 1 LEFT homepage

Used by educators and journalists of any level, this pioneering book is an essential read for learning about the best-practices for verifying user-generated content and developing appropriate verification processes.

section figure

Detailed courses and expert interviews for all workflow levels

Quality journalism
Countering hate speech

Julia Mozer

Video course
Fundamental search for journalists

Vincent Ryan

Coding
Python for journalists

Winny de Jong

Best practices
When to hire a data journalist

Winny de Jong

Data analysis
Going Viral Using Social Media Analytics

Stijn Debrouwere

Coding
Python for journalists

Winny de Jong

Covering issues
Doing Journalism with Data: First Steps, Skills and Tools

Paul Bradshaw, Steve Doig, Simon Rogers, Nicolas Kayser-Bril, Alberto Cairo

Video course
Fundamental search for journalists

Vincent Ryan

Data collection
Cleaning Data in Excel

Maarten Lambrechts

Quality journalism
Countering hate speech

Julia Mozer

Data visualisation
Mapping for Journalists

Maarten Lambrechts

Coding
Python for journalists

Winny de Jong

Covering issues
Doing Journalism with Data: First Steps, Skills and Tools

Paul Bradshaw, Steve Doig, Simon Rogers, Nicolas Kayser-Bril, Alberto Cairo

Data visualisation
Charting Tools for the Newsroom

Maarten Lambrechts

Data analysis
Going Viral Using Social Media Analytics

Stijn Debrouwere

Data collection
Cleaning Data in Excel

Maarten Lambrechts

Best practices
When to hire a data journalist

Winny de Jong

Data visualisation
Mapping for Journalists

Maarten Lambrechts

Case studies
Verification: The Basics

Craig Silverman, Claire Wardle

Learn data journalism through the power of community

Join the other 9,000 members to participate in our community, to exchange ideas and stay up-to-date with the latest on data journalism.

section figure

"Hi I am Francis from South Sudan"

"with open('reactorUnit.csv', 'w', newline='') as myFile: for row in table.find_all('tr'): cells =..."

"I think we should replace df = df.drop('Unnamed: 0', 1) --> I think it is no longer in use. with del..."

"When I wrote and run 'import pandas as pd' from jupyter it gives the following error: ModuleNotFoundError ..."

"Very interesting! Thank you!"

"First, thank you for this opportunity course."

"Can't seem to reach checkdesk.org right now. Hmmm..."

"Can I use Colaboratory instead of Conda? How would I apply it for that?"

"Everything's great so far."

"I dont see the quiz on What is data journalism?"

"Nice, short and highly informative course. Thank You!"

"Where is the quiz?"

"Short and concise course. Can't believe such good content is available for free. Thanks DataJournalism.com. Planning..."

"Pretty cool instruction! It directly shows me what a good and bad visualisation is."

"This is really wonderful, I learnt a lot. Thank you Sir."

"I am finding it hard to have the data displayed on my QGIS. Can't say if it is the version. If i click on the data,..."

"Thanks that was a good inside look"

"It was a nice presentation. Got a picture of managing a data journalism project in a nutshell"

"Thanks for the guidance"

"There is a lot we can do with excel."

"I believe that Marksta and Tagg.ly are also outdated. Are there any alternatives?"

"Geosocialfootprint,com isn't working properly. Are there any substitutes ?"

"I like instad.io It is a free online restyler that converts a chart (Excel/Google Sheets) or, for example, a..."

"Amazing course! Thank you, Maarten!"

"This topic is also covered a lot in radio shows on https://emisorasderadioonline.es/"

"Thank you very much. What I love the most from this course is the way Stijn Debrouwere thinks about Analytics and..."

"I cannot download the excel file!"

"In these chart-builder videos some common data presentation mistakes are made. for example the scatter plot in this..."

"Great, this is very insightful and eye opener. Excellent presentations, Thanks Mr. Rogers."

"This is so awesome! Really great professor. He explains everything in very simple manner."

"Same here. The version installed is Zurich"

"What an amazing, interesting and useful course. Thank you, Maarten Lambrechts."

"Excellent Martin - learnt a lot - you explain very well. Thank you"

"Great beginning!"

"Hi Vincent. I tried searching for flourish.studio/newsroom but it says the page doesn't exist. Any advice on how to..."

"The biggest problem is, especially in developing countries, that the huge part of civil society is not developed..."

"Hi Winny, I have tried to perform web scraping on two different websites but not successful. The error is "list..."

"Thank you for sharing the list of investigation tools! This is fantastic. As a Canadian living in Montreal, I'm a..."

"Predictive analytics has grown in popularity in the healthcare and medical research communities but perhaps nothing..."

"Dear Erik, thank you for your detailed article, authentic voice, understandable. I am Magda from Greece and i have a..."

"Realizing that Reality is not what we make of it, the job for all human adults is to strive to make things clear..."

"Great Insights about data scraping! They're very helpful. Here is a blog I would love to..."

"Hi, similar data is found here: https://data.world/datamil/world-war-ii-thor-data. It holds bombings of the entire world"

"I watched this course video on VIMEO instead of on-site - will this be ok as course participation? Also, is it..."

"For whoever interested on learning about Chartbuilder please note that Quartz is no longer developing or supporting..."

"Thank you for bringing this to our attention Tiberio. The resources are updated."

"Hi Sir ..i m very very Excited"

"I am Wajahat Ullah from Pakistan. I am student of journalism and Mass communication at AWKUM."

"You make essential points for writers coming to data journalism. (Also, you provide analytic specialist with..."

"I've gained so much insight as a data-journalism enthusiast after reading this article. I'm really looking forward..."

"What a great infographic! I am amazed. I have never saw an infographic, which is colourful and informative about the..."

"For a social bookmarking site, I'd suggest https://tagpacker.com Before delicious.com was retired and became a..."

"Everyblock seems to be run down by new owner Nextdoor"

"What about the countries of the conflicts wars internal like Libya?"

"hier steht gar nicht, wer den Artikel geschrieben hat, er war es: http://www.nickdiakopoulos.com/publications/"

"Thank you for this article - it made me inspired. I'm a synesthete (seeing colours and shapes of touch, music,..."

"Fantastic Newsletter issue. Thanks for providing all this for free."

"Very interesting! Thank you!"

"When I wrote and run 'import pandas as pd' from jupyter it gives the following error: ModuleNotFoundError ..."

"with open('reactorUnit.csv', 'w', newline='') as myFile: for row in table.find_all('tr'): cells =..."

"Can I use Colaboratory instead of Conda? How would I apply it for that?"

"Hi I am Francis from South Sudan"

"I think we should replace df = df.drop('Unnamed: 0', 1) --> I think it is no longer in use. with del..."

"I am finding it hard to have the data displayed on my QGIS. Can't say if it is the version. If i click on the data,..."

"There is a lot we can do with excel."

"Everything's great so far."

"Where is the quiz?"

"Excellent Martin - learnt a lot - you explain very well. Thank you"

"This is really wonderful, I learnt a lot. Thank you Sir."

"Amazing course! Thank you, Maarten!"

"Hi Winny, I have tried to perform web scraping on two different websites but not successful. The error is "list..."

"Nice, short and highly informative course. Thank You!"

"Short and concise course. Can't believe such good content is available for free. Thanks DataJournalism.com. Planning..."

"This is so awesome! Really great professor. He explains everything in very simple manner."

"I watched this course video on VIMEO instead of on-site - will this be ok as course participation? Also, is it..."

"Thank you very much. What I love the most from this course is the way Stijn Debrouwere thinks about Analytics and..."

"Hi, similar data is found here: https://data.world/datamil/world-war-ii-thor-data. It holds bombings of the entire world"

"Thank you for bringing this to our attention Tiberio. The resources are updated."

"The biggest problem is, especially in developing countries, that the huge part of civil society is not developed..."

"I've gained so much insight as a data-journalism enthusiast after reading this article. I'm really looking forward..."

"Same here. The version installed is Zurich"

"Thank you for this article - it made me inspired. I'm a synesthete (seeing colours and shapes of touch, music,..."

"Fantastic Newsletter issue. Thanks for providing all this for free."

"First, thank you for this opportunity course."

"Thanks for the guidance"

"This topic is also covered a lot in radio shows on https://emisorasderadioonline.es/"

"I dont see the quiz on What is data journalism?"

"For whoever interested on learning about Chartbuilder please note that Quartz is no longer developing or supporting..."

"Can't seem to reach checkdesk.org right now. Hmmm..."

"Hi Sir ..i m very very Excited"

"I am Wajahat Ullah from Pakistan. I am student of journalism and Mass communication at AWKUM."

"What a great infographic! I am amazed. I have never saw an infographic, which is colourful and informative about the..."

"You make essential points for writers coming to data journalism. (Also, you provide analytic specialist with..."

"Pretty cool instruction! It directly shows me what a good and bad visualisation is."

"For a social bookmarking site, I'd suggest https://tagpacker.com Before delicious.com was retired and became a..."

"Everyblock seems to be run down by new owner Nextdoor"

"What about the countries of the conflicts wars internal like Libya?"

"hier steht gar nicht, wer den Artikel geschrieben hat, er war es: http://www.nickdiakopoulos.com/publications/"

"Great Insights about data scraping! They're very helpful. Here is a blog I would love to..."

"I cannot download the excel file!"

"Realizing that Reality is not what we make of it, the job for all human adults is to strive to make things clear..."

"Dear Erik, thank you for your detailed article, authentic voice, understandable. I am Magda from Greece and i have a..."

"Predictive analytics has grown in popularity in the healthcare and medical research communities but perhaps nothing..."

"Thank you for sharing the list of investigation tools! This is fantastic. As a Canadian living in Montreal, I'm a..."

"Thanks that was a good inside look"

"It was a nice presentation. Got a picture of managing a data journalism project in a nutshell"

"Hi Vincent. I tried searching for flourish.studio/newsroom but it says the page doesn't exist. Any advice on how to..."

"Great beginning!"

"What an amazing, interesting and useful course. Thank you, Maarten Lambrechts."

"I believe that Marksta and Tagg.ly are also outdated. Are there any alternatives?"

"Geosocialfootprint,com isn't working properly. Are there any substitutes ?"

"I like instad.io It is a free online restyler that converts a chart (Excel/Google Sheets) or, for example, a..."

"In these chart-builder videos some common data presentation mistakes are made. for example the scatter plot in this..."

"Great, this is very insightful and eye opener. Excellent presentations, Thanks Mr. Rogers."

17500+

Registered data journalism students, from all over the world

27+

Over 27 hours of quality free video courses to watch and follow

70+

70 hours of reading material, including 5 Handbooks and Long Reads

202

Content from contributors and experts in their field