Where journalism meets data
Need to learn new data skills, increase your data journalism knowledge or advance your career?

Our original Long Reads, written by the best data experts
Climate change through a solutions and data lens
How solutions storytelling can engage local communities and bring local reporters together to solve the climate crisis.
New climate metrics for new climate conversations
New metrics and visualisations are being developed by a multidisciplinary team of researchers, designers and journalists to reshape how we interpret the climate crisis and its impact on people's daily lives.
Data gives voice to women on climate change
Scientific evidence clearly shows that women bear the brunt of climate change, yet until recently, scant attention has been paid to their plight. In many instances, the data are there, waiting to be discovered.
Kill switch: reporting on and during internet shutdowns
What can data journalists do to report on Internet shutdowns, which are becoming increasingly common by governments? This article provides a guide with real-world examples you can use to raise your voice.
Putting data back into context
Data are never neutral ‘givens’, but always situated in a particular context, collected for a particular reason -- and it’s crucial that data journalists understand these.
The unspoken rules of visualisation
Designers often follow a set of strict conventions when creating visualisations. Kaiser Fung examines the fundamental rules of data visualisation, why they are important, and when it is okay to break them.
Reporting beyond the case numbers: How to brainstorm COVID-19 data story ideas
While many journalists around the world report the daily infection rate and death toll of COVID-19, audiences are seeking other stories that show the impact of the virus on their lives. How can journalists tell those wider stories with data?
The essential lies in news maps
In order to display three-dimensional world we live in, journalists are forced to distort reality. And every map does so in its own way. Maarten Lambrechts looks at commonly used maps and how to avoid being misled by them.
The essential lies in news maps
In order to display three-dimensional world we live in, journalists are forced to distort reality. And every map does so in its own way. Maarten Lambrechts looks at commonly used maps and how to avoid being misled by them.
Putting data back into context
Data are never neutral ‘givens’, but always situated in a particular context, collected for a particular reason -- and it’s crucial that data journalists understand these.
Spreadsheets for journalism
Many journalists see themselves as “word people” and shy away from writing about numbers. Brant Houston shows how to embrace math with an overview of spreadsheets and functions for beginners.
Designing data visualisations with empathy
How do you get audience members, much less the journalists presenting a story, to walk a mile in the shoes of a dot? Or a bar chart? P. Kim Bui provides three approaches for achieving empathy in data visualisations.
Our Handbooks
For Disinformation And Media Manipulation
The latest edition of the Verification Handbook arrives at a critical moment. Today’s information environment is more chaotic and easier to manipulate than ever before. This book equips journalists with the knowledge to investigate social media accounts, bots, private messaging apps, information operations, deep fakes, as well as other forms of disinformation and media manipulation.
The first resource of its kind, it builds on the first edition of the Verification Handbook and the Verification Handbook for Investigative Reporting.
The book is published by the European Journalism Centre and supported by Craig Newmark Philanthropies.
Towards a Critical Data Practice
What is data journalism? What is it for? What might it do? What opportunities and limitations does it present? Who and what is involved in making and making sense of it?
The new edition of the Data Journalism Handbook explores new and innovative ways in which data is analysed, created and used in the context of journalism. And beyond that: it also reflects on the social, cultural, political and economic circumstances in which data journalism is embedded.
How journalists can use data to improve the news
When you combine the sheer scale and range of digital information now available with a journalist’s "nose for news" and her ability to tell a compelling story, a new world of possibility opens up. Explore the potential, limits, and applied uses of this new and fascinating field.
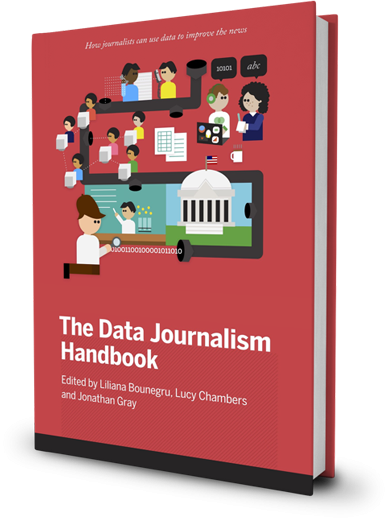
This valuable handbook has attracted scores of contributors since the European Journalism Centre and the Open Knowledge Foundation launched the project at MozFest 2011. Through a collection of tips and techniques from leading journalists, professors, software developers, and data analysts, you’ll learn how data can be either the source of data journalism or a tool with which the story is told—or both.
A Guide To Online Search And Research Techniques For Using UGC And Open Source Information In Investigations
Based on the conclusions of the first book, this second edition of the Verification Handbook sheds light on the use of open data and open source information to produce critical journalistic investigations.
As new challenges have emerged in the digital sphere, wider opportunities to carry out more comprehensive investigations have arisen as well. The authors of the book take the reader on a walk-through to hone their online investigation tactics, providing them with step-by-step guidance to apply research, fact-checking, and data journalism techniques.
A Definitive Guide To Verifying Digital Content For Emergency Coverage
The first edition of the Verification Handbook has become a definitive reference for professionals worldwide. This book laid the foundations for the process of digital content verification and opened a necessary debate about the steps to follow for ensuring the accuracy of reporting within emergency situations.
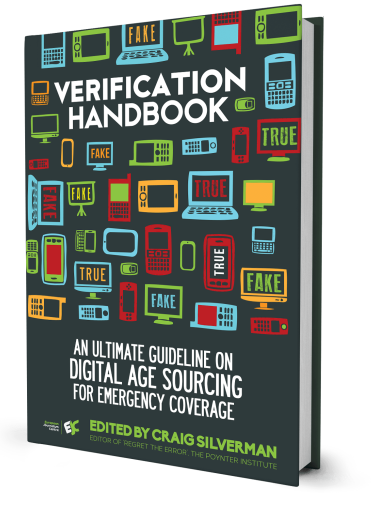
Used by educators and journalists of any level, this pioneering book is an essential read for learning about the best-practices for verifying user-generated content and developing appropriate verification processes.

Detailed courses and expert interviews for all workflow levels
Learn data journalism through the power of community
Join the other 9,000 members to participate in our community, to exchange ideas and stay up-to-date with the latest on data journalism.

Registered data journalism students, from all over the world
Over 27 hours of quality free video courses to watch and follow
70 hours of reading material, including 5 Handbooks and Long Reads
Content from contributors and experts in their field


